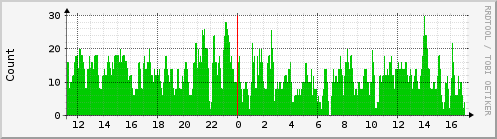
This page shows the >1.0um Particulate Count in 0.1L Air reported by the PMS5003 particulate matter sensor on particle.
| Max >1.0um: | 37.5 Count | Average >1.0um: | 17.3 Count | Current >1.0um: | 10.6 Count |
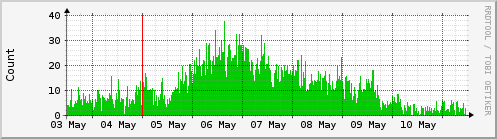
| Max >1.0um: | 28.5 Count | Average >1.0um: | 17.4 Count | Current >1.0um: | 18.1 Count |
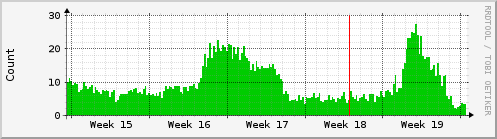
| Max >1.0um: | 28.2 Count | Average >1.0um: | 8.7 Count | Current >1.0um: | 17.3 Count |
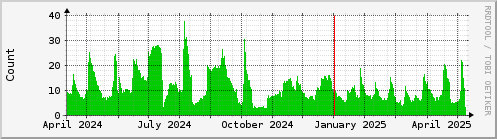
| Max >1.0um: | 269.3 Count | Average >1.0um: | 14.7 Count | Current >1.0um: | 17.6 Count |
| GREEN ### | >1.0um Particulate Count in 0.1L Air |

![]()
 |
 |
 |
| version 2.16.2 | Tobias Oetiker<oetiker@ee.ethz.ch> |
| and Dave Rand <dlr@bungi.com> | |
| mrtg-rrd.cgi version 0.7p | Jan "Yenya" Kasprzak <kas@fi.muni.cz> |
| Minor hacks by Mark Kamichoff <prox@prolixium.com> | |