Traffic Analysis for eth1 -- orca.prolixium.com
| System: | orca in Seattle, WA |
| Maintainer: | Mark Kamichoff <prox@prolixium.com> |
| Description: | Red-Hat,-Inc-Device-0001 |
| ifType: | ethernetCsmacd (6) |
| ifName: | eth1 |
| Max Speed: | 1000.0 Mbits/s |
| Ip: | 10.3.254.108 (et1.orca.prolixium.net) |
The statistics were last updated Tuesday, 14 July, 07:24:21 EDT
`Daily' Graph (5 Minute Average)
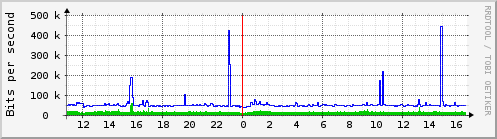
| Max In: |
115.7 kb/s (0.0%) |
|
Average In: |
54.6 kb/s (0.0%) |
|
Current In: |
50.8 kb/s (0.0%) |
| Max Out: |
882.4 kb/s (0.1%) |
|
Average Out: |
108.8 kb/s (0.0%) |
|
Current Out: |
102.4 kb/s (0.0%) |
`Weekly' Graph (30 Minute Average)
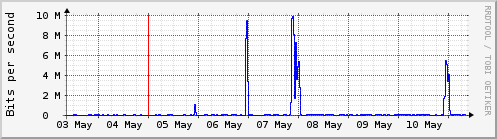
| Max In: |
82.0 kb/s (0.0%) |
|
Average In: |
55.8 kb/s (0.0%) |
|
Current In: |
52.9 kb/s (0.0%) |
| Max Out: |
3236.2 kb/s (0.3%) |
|
Average Out: |
131.6 kb/s (0.0%) |
|
Current Out: |
98.6 kb/s (0.0%) |
`Monthly' Graph (2 Hour Average)
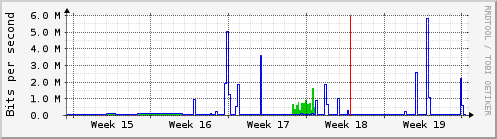
| Max In: |
84.0 kb/s (0.0%) |
|
Average In: |
49.6 kb/s (0.0%) |
|
Current In: |
51.9 kb/s (0.0%) |
| Max Out: |
504.2 kb/s (0.1%) |
|
Average Out: |
105.8 kb/s (0.0%) |
|
Current Out: |
173.9 kb/s (0.0%) |
`Yearly' Graph (1 Day Average)
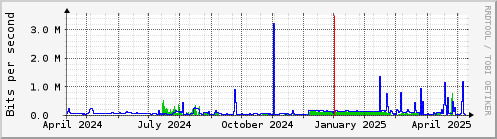
| Max In: |
65.4 kb/s (0.0%) |
|
Average In: |
41.6 kb/s (0.0%) |
|
Current In: |
55.6 kb/s (0.0%) |
| Max Out: |
765.4 kb/s (0.1%) |
|
Average Out: |
91.0 kb/s (0.0%) |
|
Current Out: |
106.7 kb/s (0.0%) |
| GREEN ### |
Incoming Traffic in Bits per Second |
| BLUE ### |
Outgoing Traffic in Bits per Second |


