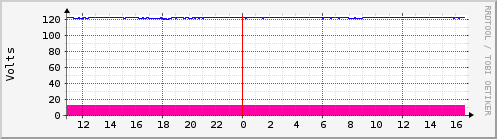
This summary page shows the battery potential (hot pink) and the utility, or wall, potential (blue) of the APC Back-UPS Pro 700 attached to evolution.
| Max Battery: | 13.0 V | Average Battery: | 13.0 V | Current Battery: | 13.0 V | ||
| Max Utility: | 123.0 V | Average Utility: | 121.9 V | Current Utility: | 121.0 V |
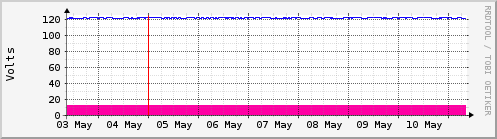
| Max Battery: | 13.0 V | Average Battery: | 13.0 V | Current Battery: | 13.0 V | ||
| Max Utility: | 123.0 V | Average Utility: | 122.0 V | Current Utility: | 122.0 V |
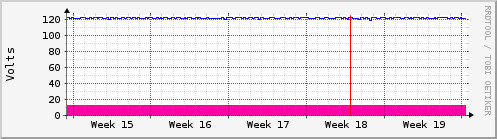
| Max Battery: | 13.0 V | Average Battery: | 13.0 V | Current Battery: | 13.0 V | ||
| Max Utility: | 122.8 V | Average Utility: | 121.9 V | Current Utility: | 122.0 V |
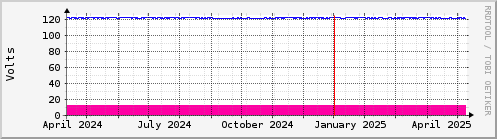
| Max Battery: | 13.3 V | Average Battery: | 13.0 V | Current Battery: | 13.0 V | ||
| Max Utility: | 122.2 V | Average Utility: | 121.6 V | Current Utility: | 121.8 V |
| HOTPINK ### | Battery Potential in Volts |
| BLUE ### | Utility Potential in Volts |

![]()
 |
 |
 |
| version 2.16.2 | Tobias Oetiker<oetiker@ee.ethz.ch> |
| and Dave Rand <dlr@bungi.com> | |
| mrtg-rrd.cgi version 0.7p | Jan "Yenya" Kasprzak <kas@fi.muni.cz> |
| Minor hacks by Mark Kamichoff <prox@prolixium.com> | |